About the project
Feeno is an analytics service for Wildberries sellers. A seller connects their marketplace API keys, and the service gathers the store's key metrics on a single page: from orders and sales to returns, logistics and net profit. We designed the interface of the user dashboard: the main dashboard, product reports, cost of goods calculation and the support section.
The challenge
The statistics provided by the marketplace itself answer the question "how much was sold", but not "how much was earned". To calculate profit, sellers have to export reports, combine them in spreadsheets and manually subtract commission, logistics, purchasing and packaging costs. We needed to build a dashboard where these calculations happen automatically, and the seller sees the bottom line and can break it down to a specific SKU.
A separate requirement was support for multiple stores and brands. Many sellers run more than one Wildberries account, and it is more convenient to compare them in one place.
Dashboard
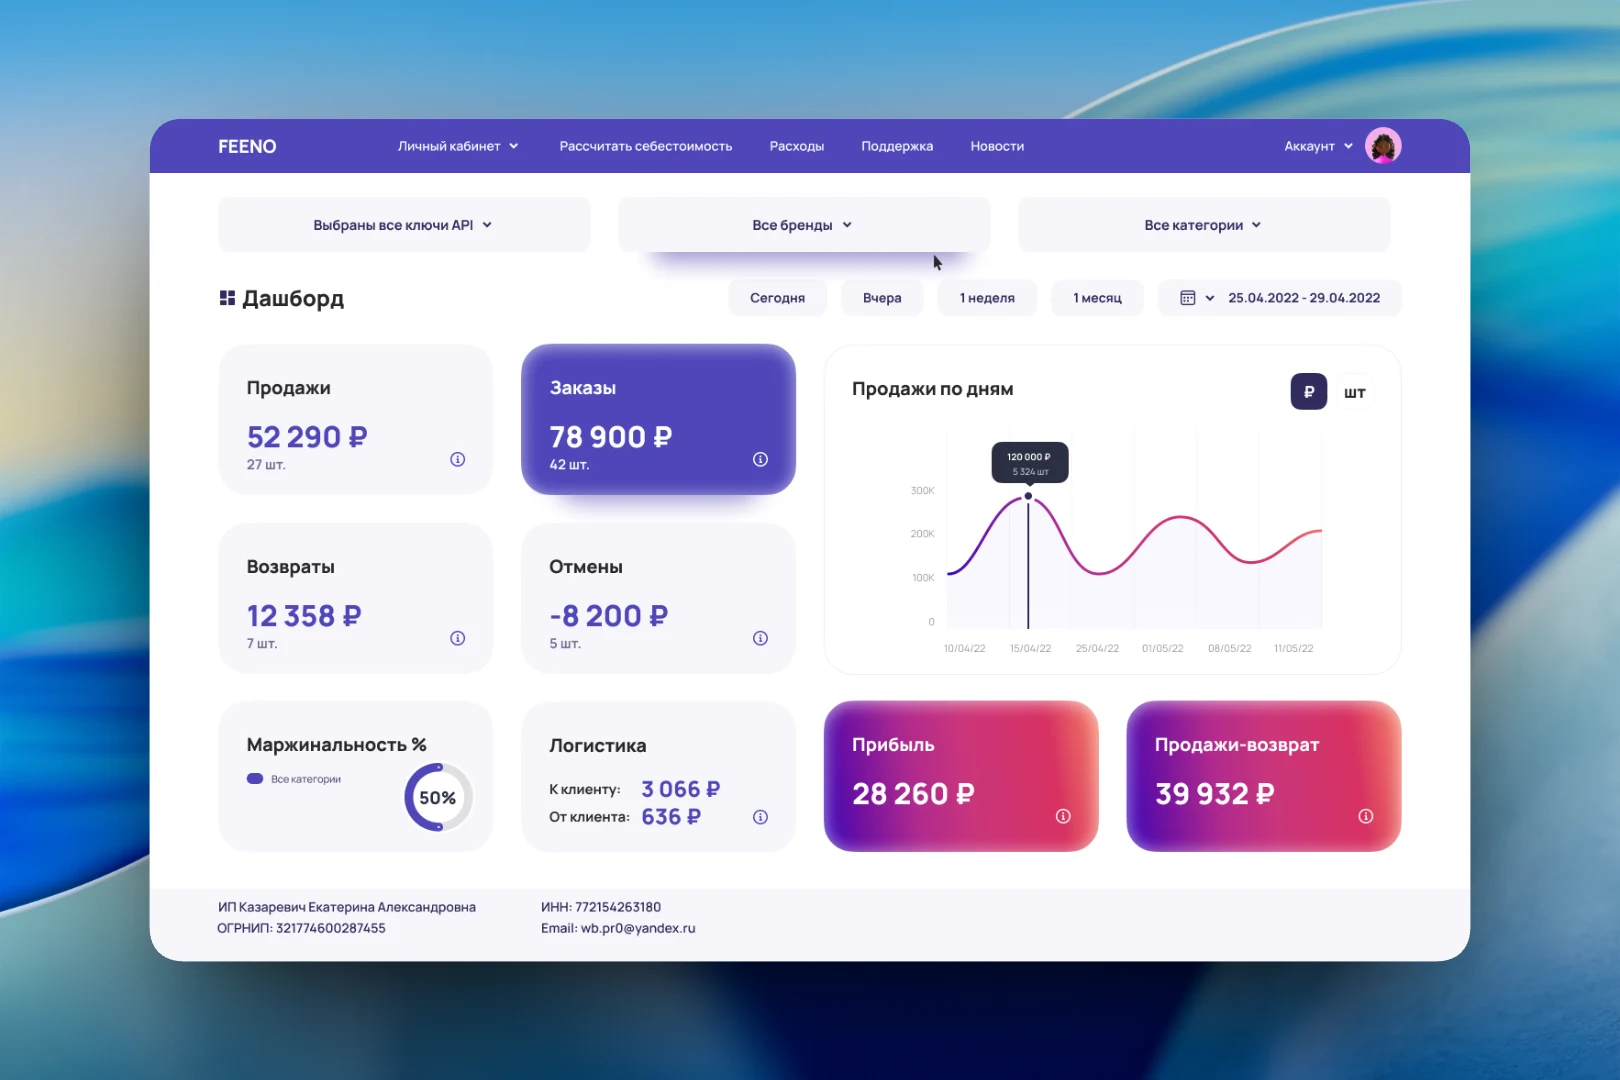
The main screen is a set of cards with the core metrics for the selected period: sales, orders, returns, cancellations, logistics to and from the customer, margin as a percentage, profit and "sales minus returns". Each card shows the amount in rubles and the quantity in units, and an "i" icon explains how the metric is calculated. On the right is a daily sales chart that switches between rubles and units, with a tooltip for every data point.
Above the dashboard are three filters that work across all screens: API keys, brands and categories. The period is chosen with quick buttons — "Today", "Yesterday", "1 week", "1 month" — or in a calendar. This way the same screen answers both "how did yesterday go" and "how is a particular brand performing this month".
Product reports
From the dashboard, the seller moves on to detailed tables. The "Sales" section shows each product's photo, SKU, brand, name, price, cost of goods, commission, category, profit and logistics. Every column has sorting and a tooltip, the number of rows per page is adjustable, and there is a search. The first column is "Self-purchase": marked orders are excluded from the calculations so that buyouts made for promotion do not distort the real sales picture.
The "Cancellations" section follows the same pattern, but instead of profit it calculates lost profit and the logistics the seller paid for cancelled orders. The unified table structure lets users switch between reports without getting used to a new screen.
Cost of goods
Profit cannot be calculated without the cost of goods, and the marketplace does not know it. That is why the dashboard has a dedicated section where the seller fills in the cost components for each SKU: purchase price, packaging, delivery to their own warehouse and to the WB warehouse. Values are edited right in the table row, after which all reports are recalculated with the actual costs.
Support
Questions about calculations are resolved through tickets inside the dashboard. The conversation looks like a chat: user messages and administrator replies with date and time, and at the bottom a field for a new message and an attachment button for adding a screenshot or a report file.
Result
Feeno replaces a seller's collection of spreadsheets: data is pulled in via API, the cost of goods is entered once, and profit, margin, losses from cancellations and logistics are calculated automatically. The seller sees the whole store on the dashboard and can drill down to an individual product, brand or period in a couple of clicks.